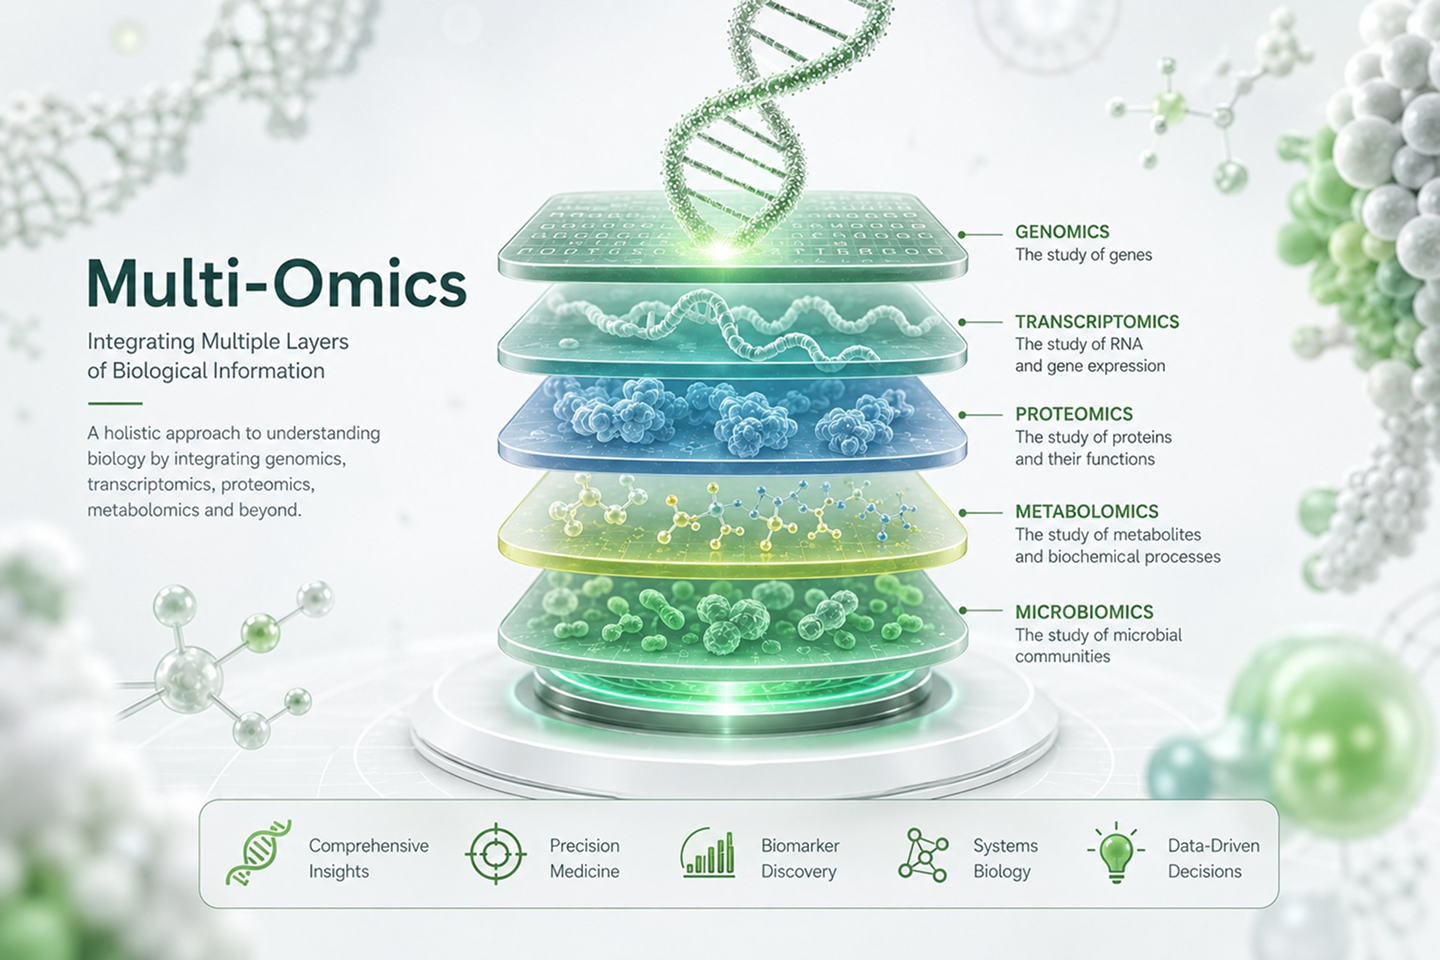
Reveal the spatial organization of the entire transcriptome within intact tissue sections using our comprehensive 10x Genomics Visium Spatial Transcriptomics services. Supporting Fresh Frozen (FF), FFPE, and Fixed Frozen (FxF) sample types, our workflow combines high-quality tissue imaging with genome-wide gene expression profiling to provide a detailed molecular map while preserving native tissue architecture. This integrated approach enables researchers to uncover tissue heterogeneity, identify spatially distinct cell populations, and gain deeper biological insights for both basic and translational research.
Core Technical Advantages
• Broad Sample Compatibility
Our optimized laboratory workflows support a wide variety of tissue preservation methods, including Fresh Frozen (FF), FFPE, and Fixed Frozen (FxF) samples. Customized tissue preparation, sectioning, and permeabilization protocols are applied to maximize RNA quality, improve transcript capture efficiency, and ensure reliable spatial transcriptomic results across diverse sample types.
Capture genome-wide gene expression directly from intact tissue sections while preserving their spatial organization. High-resolution molecular profiling is seamlessly integrated with Hematoxylin and Eosin (H&E) or Immunofluorescence (IF) imaging, enabling accurate correlation of transcriptional activity with tissue morphology across large imaging areas.
• End-to-End Bioinformatics & Interactive Data Visualization
Our complete bioinformatics workflow transforms raw sequencing data into biologically meaningful insights. Services include quality assessment, spatial gene expression analysis, clustering, cell type annotation, pathway analysis, and advanced visualization. Final deliverables include publication-ready figures, comprehensive analytical reports, and interactive Loupe Browser files for intuitive exploration of spatial transcriptomic datasets.
Spatial transcriptomics is a powerful genomics technology that combines gene expression profiling with spatial information, allowing researchers to measure RNA molecules while preserving their original location within intact tissue sections. Unlike conventional RNA sequencing, which analyzes dissociated cells and loses tissue architecture, spatial transcriptomics reveals where genes are expressed, providing a comprehensive view of cellular organization, tissue structure, and biological function.
By retaining the spatial context of gene expression, researchers can identify distinct cellular populations, investigate interactions between neighboring cells, and explore how tissue architecture influences biological processes. This capability has made spatial transcriptomics an invaluable tool in fields such as cancer research, neuroscience, developmental biology, immunology, pathology, and regenerative medicine.
Advancing Molecular Research Through Spatial Biology
Recent advances in high-resolution microscopy, fluorescence imaging, and next-generation sequencing have transformed our ability to study complex tissues at unprecedented resolution. Spatial transcriptomics integrates these technologies to generate genome-wide expression profiles while maintaining the natural organization of cells within the tissue.
This integrated approach enables researchers to:
• Visualize gene expression within its native tissue environment.
• Identify spatially distinct cell populations and tissue domains.
• Investigate cell-to-cell communication and microenvironment interactions.
• Discover molecular changes associated with development, disease progression, and therapeutic response.
• Correlate histological features with transcriptomic signatures for deeper biological insights.
• By combining molecular and morphological information, spatial transcriptomics provides a more complete understanding of tissue biology than traditional sequencing approaches alone.
FFPE Spatial Transcriptomics
The rapid evolution of spatial transcriptomics has expanded its application to Formalin-Fixed Paraffin-Embedded (FFPE) tissues, allowing researchers to analyze valuable archived clinical specimens that were previously difficult to study using transcriptome-wide spatial approaches.
Modern FFPE-compatible technologies, including 10x Genomics Visium for FFPE, integrate high-resolution tissue imaging with targeted spatial gene expression profiling. These workflows enable researchers to investigate thousands of genes while preserving tissue morphology, making them particularly valuable for translational research, pathology, biomarker discovery, and retrospective clinical studies.
The ability to analyze archived FFPE samples has significantly broadened opportunities for studying tissue heterogeneity, disease mechanisms, cellular organization, and molecular biomarkers across a wide range of human diseases.
The 10x Genomics Visium Spatial Transcriptomics platform combines spatially barcoded capture technology with next-generation sequencing to generate genome-wide gene expression profiles while preserving the original architecture of tissue sections. This innovative workflow enables researchers to determine not only which genes are expressed, but also where they are expressed within the tissue.
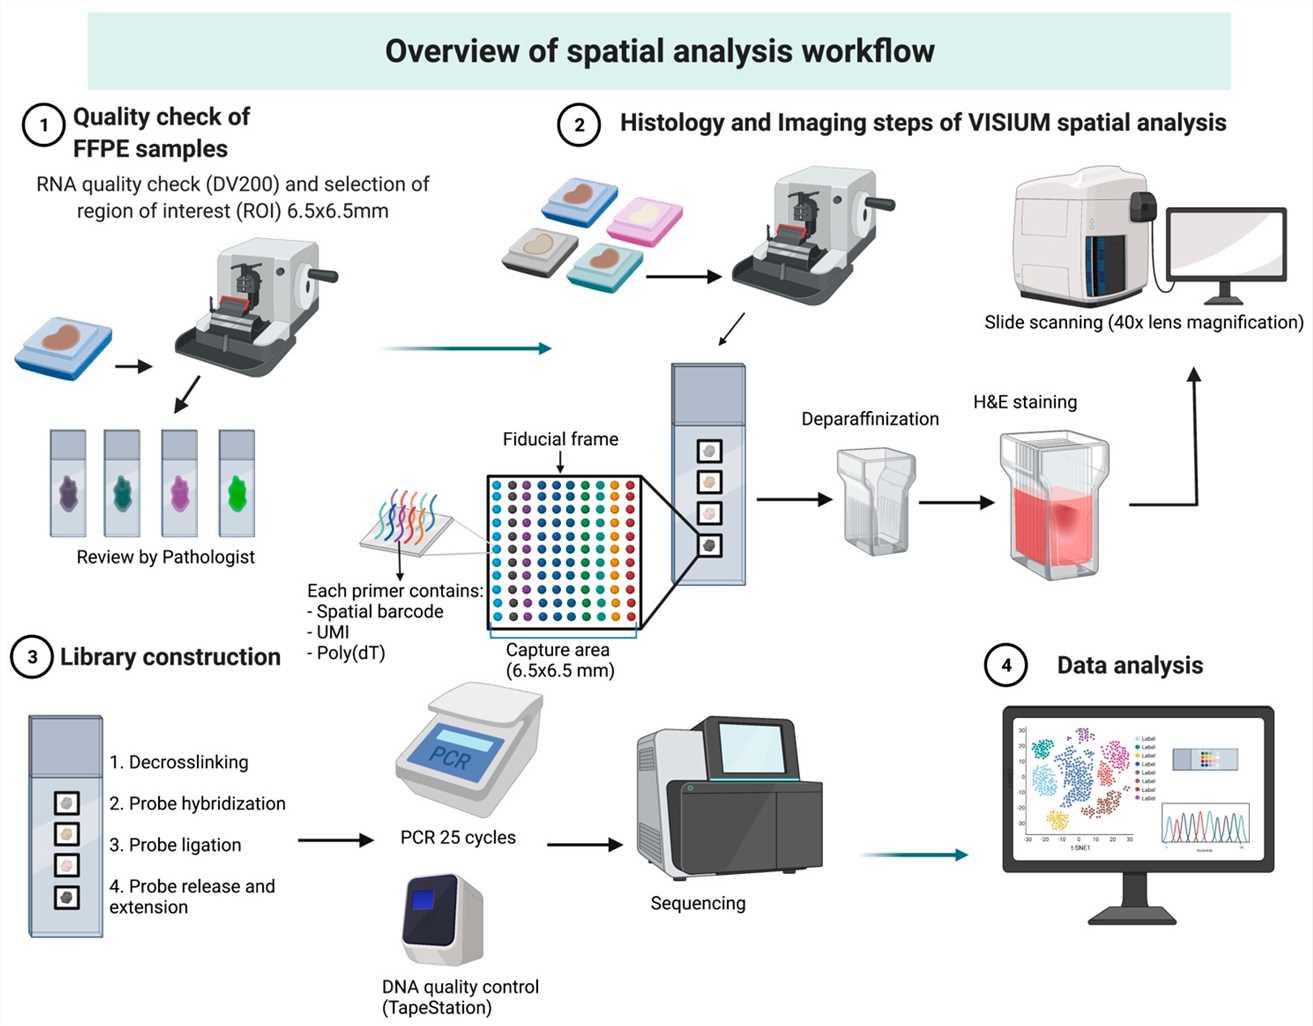
At the core of the technology is the Visium Spatial Gene Expression Slide, which contains four independently addressable capture areas. Each standard capture area measures approximately 6.5 × 6.5 mm and consists of nearly 5,000 spatially barcoded capture spots arranged in a highly ordered grid. Every capture spot is approximately 55 µm in diameter with 100 µm center-to-center spacing, allowing RNA molecules to be captured from localized regions of the tissue while preserving spatial information.
Each capture spot contains oligonucleotides engineered with three essential components:
• A unique spatial barcode that identifies the exact location of every captured transcript within the tissue.
• A Unique Molecular Identifier (UMI) that distinguishes individual RNA molecules and minimizes amplification bias by enabling accurate transcript counting.
• A poly(dT) capture sequence that selectively binds polyadenylated messenger RNA (mRNA) released from the tissue during permeabilization.
Following tissue permeabilization, messenger RNA molecules diffuse onto the underlying capture spots and hybridize to the poly(dT) capture probes. Reverse transcription is then performed directly on the slide, generating complementary DNA (cDNA) molecules that retain both their molecular identity and spatial coordinates.
The spatially indexed cDNA is subsequently recovered, amplified, and converted into sequencing libraries compatible with Illumina platforms. During downstream bioinformatics analysis, sequencing reads are matched to their corresponding spatial barcodes and aligned with high-resolution histological images of the tissue.
The final result is a comprehensive spatial gene expression map that accurately correlates transcriptomic information with tissue morphology. This enables researchers to visualize genome-wide expression patterns, identify spatially distinct cellular populations, characterize tissue microenvironments, and investigate complex biological processes while preserving the native organization of the sample.
Spatial Transcriptomics Sequencing Workflow
Our streamlined Spatial Transcriptomics workflow combines optimized laboratory protocols with advanced sequencing and bioinformatics to generate high-quality spatial gene expression data while preserving tissue architecture.
1. Tissue Preparation & Sectioning
High-quality tissue is carefully prepared and cryosectioned to obtain thin, intact sections suitable for spatial transcriptomic analysis. The tissue sections are then mounted onto specialized spatial capture slides and imaged using high-resolution histological techniques, such as Hematoxylin & Eosin (H&E) staining or Immunofluorescence (IF), to preserve morphological context.
2. RNA Capture & Spatial Barcode Labeling
Following tissue fixation and controlled permeabilization, messenger RNA (mRNA) is released from the tissue and captured by spatially barcoded oligonucleotide probes embedded within the capture slide. Each captured transcript is assigned a unique spatial coordinate, enabling precise mapping of gene expression back to its original location within the tissue.
3. Library Preparation
The captured RNA molecules are reverse transcribed into complementary DNA (cDNA), followed by amplification and sequencing library construction using optimized protocols. Rigorous quality control measures are performed throughout the process to ensure high library complexity, reproducibility, and sequencing accuracy.
4. High-Throughput Sequencing
Prepared libraries are sequenced on advanced next-generation sequencing (NGS) platforms to generate comprehensive transcriptomic datasets. Sequencing depth is optimized according to the sample type and research objectives to maximize transcript detection and data quality.
Sequencing data are processed using specialized spatial transcriptomics bioinformatics pipelines to quantify gene expression, identify spatially variable genes, perform clustering and cell type analysis, and reconstruct spatial expression maps. The resulting molecular profiles are integrated with histological images to provide intuitive visualizations of gene expression patterns across the tissue, enabling deeper insights into tissue organization, cellular interactions, and biological function.
Visium Spatial Gene Expression for Fresh Frozen Tissue Service Workflow
Visium Spatial Gene Expression for FFPE Service Workflow
Service Specification
Sample requirements Fresh Tissue: 6.5mm^3 FFPE: 6.5mm^3; DV200 > 50% Species Range: Human, Mouse, Rat. For other species, please consult.
Sequencing Sequencing Platform: Illumina NovaSeq 6000 Sequencing Pattern: PE150 Sequencing Data Volume: ≥50k read pairs per spot.
Bioinformatics Analysis We provide customized bioinformatics analysis including: Raw sequence data Sequencing data quality assessment and filtering Spot quality control Data alignment Data standardization Spot clustering Spot subpopulation analysis Marker analysis Cell type identification Anatomical region annotation Cell communication analysis Inter-sample differential analysis Inter-annotation region differential analysis
Sample Preparation
Proper sample preparation is one of the most critical factors influencing the success of a spatial transcriptomics experiment. Preserving both RNA integrity and tissue morphology is essential for generating reliable spatial gene expression data.
For fresh frozen tissue, rapid cryopreservation should be performed using isopentane (2-methylbutane) pre-cooled with liquid nitrogen or dry ice after embedding the specimen in OCT compound. This method is recommended because it minimizes ice crystal formation and better preserves cellular architecture. Direct immersion of tissue into liquid nitrogen is generally discouraged, as rapid freezing can introduce structural artifacts that may compromise downstream analysis.
Compared with traditional single-cell RNA sequencing workflows—which often require extensive tissue dissociation and optimization to obtain high-quality single-cell suspensions—spatial transcriptomics offers a more streamlined approach. Since intact tissue sections are analyzed directly, the native tissue architecture is preserved while reducing the technical challenges associated with enzymatic digestion and cell isolation.
At N2Jenomics Lab Pvt. Ltd., we provide complete guidance for tissue collection, cryopreservation, embedding, storage, and shipping to ensure optimal sample quality. Our end-to-end workflow covers tissue processing, sectioning, library preparation, sequencing, bioinformatics analysis, and comprehensive data interpretation, allowing researchers to focus on biological discovery while we manage the technical workflow.
Service Advantages
• Expert Tissue Processing
Our experienced laboratory team has optimized tissue embedding, cryosectioning, and slide preparation protocols for a wide range of tissue types, ensuring high-quality sections with excellent RNA preservation and tissue morphology.
• Comprehensive Bioinformatics Analysis
We offer an end-to-end bioinformatics pipeline that transforms raw sequencing data into meaningful biological insights. Our analyses include quality assessment, spatial clustering, differential gene expression, cell type annotation, pathway enrichment, and publication-ready visualizations.
• Robust Quality Assurance
Every project follows standardized quality control procedures throughout sample processing, library preparation, sequencing, and data analysis. This rigorous workflow ensures reproducible, accurate, and high-confidence results.
• Experienced Scientific Team
Our multidisciplinary team of molecular biologists, sequencing specialists, and bioinformaticians provides expert support throughout the project lifecycle—from experimental design and protocol optimization to data interpretation and post-project consultation.
• Complete End-to-End Service
We provide a fully integrated spatial transcriptomics solution, including:
- Tissue collection guidance and cryopreservation.
- OCT embedding and sample quality assessment.
- Cryosectioning and slide preparation.
- Histological staining and imaging.
- Library preparation and next-generation sequencing.
- Advanced spatial bioinformatics analysis.
Interactive data visualization and publication-ready reports.
Our comprehensive workflow ensures consistent data quality, faster project turnaround, and reliable support from sample submission through biological interpretation.
1. What types of tissue samples are supported for spatial transcriptomics?
Our 10x Genomics Visium Spatial Transcriptomics services support multiple tissue preservation methods, including Fresh Frozen (FF), Formalin-Fixed Paraffin-Embedded (FFPE), and Fixed Frozen (FxF) samples. Human and mouse tissues are fully supported using validated workflows, while Fresh Frozen applications can also be extended to many additional species with an appropriate reference genome or transcriptome.
Samples may be submitted as OCT-embedded tissue blocks, FFPE tissue blocks, or, in selected projects, as prepared tissue sections mounted on compatible slides. Our team can review your sample type and recommend the most suitable workflow before project initiation.
2. What is the size of each capture spot on the Visium Spatial Gene Expression Slide?
In the standard Visium Spatial Gene Expression workflow, each capture spot measures approximately 55 µm in diameter and is arranged with 100 µm center-to-center spacing across the capture area.
Each spot contains thousands of spatially barcoded capture probes that record the precise location of RNA molecules, enabling accurate mapping of gene expression back to the original tissue architecture.
3. Does Visium provide true single-cell resolution?
No. Visium is a high-resolution spatial transcriptomics platform, but it does not directly measure gene expression at single-cell resolution.
Each 55 µm capture spot typically contains RNA from multiple neighboring cells, with the exact number varying according to tissue type and cellular density.
However, when matched single-cell RNA sequencing (scRNA-seq) data are available, advanced computational approaches can estimate the cellular composition of each spot, providing detailed cell-type distribution maps and improving biological interpretation.
For applications requiring direct single-cell or subcellular spatial resolution, imaging-based technologies such as 10x Genomics Xenium may be a more appropriate choice.
4. What capture area sizes are available on the Visium Spatial Slide?
The standard Visium Spatial Gene Expression Slide features four independent capture areas, each measuring approximately 6.5 × 6.5 mm, making it suitable for a wide variety of tissue types and research applications.
For projects involving larger tissue specimens or expanded imaging requirements, additional Visium slide formats may be available depending on the selected workflow and platform configuration. Our team can
Address:Registered Office: 138, Patparganj Industrial Area, New Delhi – 110092, India
Operational Address: National Institute of Plant Genome Research (BRIC - NGGF)
Lab No. 206 and 207, Aruna Asaf Ali Marg, P.O. Box No. 10531,
New Delhi – 110067, India