QTL-seq Approach | High-Resolution QTL Mapping for Crop Research
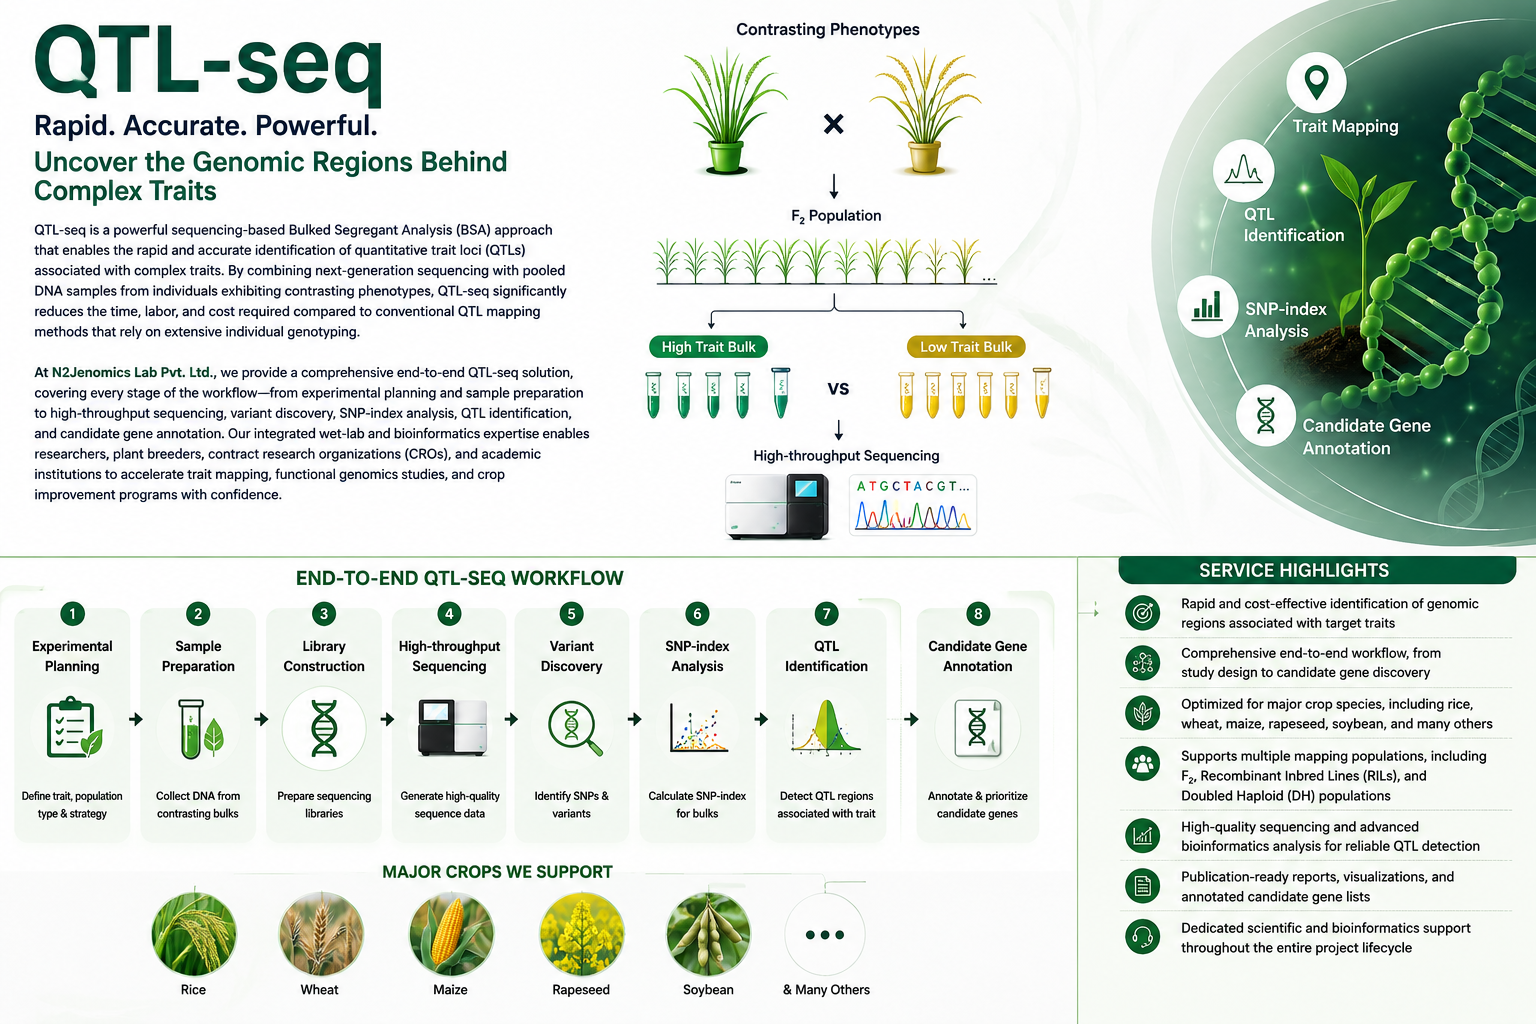
QTL-seq is a powerful sequencing-based Bulked Segregant Analysis (BSA) approach that enables the rapid and accurate identification of quantitative trait loci (QTLs) associated with complex traits. By combining next-generation sequencing with pooled DNA samples from individuals exhibiting contrasting phenotypes, QTL-seq significantly reduces the time, labor, and cost required compared to conventional QTL mapping methods that rely on extensive individual genotyping.
At N2Jenomics Lab Pvt. Ltd., we provide a comprehensive end-to-end QTL-seq solution, covering every stage of the workflow—from experimental planning and sample preparation to high-throughput sequencing, variant discovery, SNP-index analysis, QTL identification, and candidate gene annotation. Our integrated wet-lab and bioinformatics expertise enables researchers, plant breeders, contract research organizations (CROs), and academic institutions to accelerate trait mapping, functional genomics studies, and crop improvement programs with confidence.
Service Highlights
• Rapid and cost-effective identification of genomic regions associated with target traits
• Comprehensive end-to-end workflow, from study design to candidate gene discovery
• Optimized for major crop species, including rice, wheat, maize, rapeseed, soybean, and many others
• Supports multiple mapping populations, including F₂, Recombinant Inbred Lines (RILs), and • Doubled Haploid (DH) populations
• High-quality sequencing and advanced bioinformatics analysis for reliable QTL detection
• Publication-ready reports, visualizations, and annotated candidate gene lists
• Dedicated scientific and bioinformatics support throughout the entire project lifecycle
QTL-seq (Quantitative Trait Locus Sequencing) is a powerful next-generation sequencing (NGS) approach that integrates Bulked Segregant Analysis (BSA) with whole-genome resequencing to rapidly identify genomic regions associated with quantitative traits. These genomic regions, known as quantitative trait loci (QTLs), influence complex characteristics such as disease resistance, yield, flowering time, stress tolerance, and plant architecture.
Unlike conventional QTL mapping, which relies on extensive genotyping of individual progeny and multiple genetic markers, QTL-seq streamlines the process by sequencing pooled DNA samples from individuals exhibiting contrasting phenotypes. This significantly reduces the time, cost, and labor required while maintaining high mapping accuracy.
A typical QTL-seq experiment begins by crossing two genetically distinct parental lines with contrasting traits to generate a segregating population. Individuals representing the extreme ends of the phenotype are selected, and their DNA is pooled into separate bulks. By comparing allele frequencies between these bulks across the entire genome, researchers can rapidly identify candidate QTLs linked to the trait of interest.
Today, QTL-seq has become a widely adopted tool in plant breeding, crop improvement, and functional genomics. Its ability to rapidly pinpoint trait-associated genomic regions accelerate candidate gene discovery and supports marker-assisted selection, enabling breeders and researchers to make informed decisions in a fraction of the time required by traditional mapping approaches.
Why Choose the QTL-seq Approach?
• Rapid QTL Discovery - QTL-seq enables the identification of trait-associated genomic regions within weeks, dramatically reducing the time required compared to conventional QTL mapping methods.
• Cost-Effective Analysis - By sequencing pooled DNA samples instead of hundreds of individual progeny, QTL-seq minimizes library preparation, sequencing, and genotyping costs without compromising analytical accuracy.
• High Mapping Resolution - Whole-genome sequencing generates dense genetic marker information, allowing precise localization of QTLs and narrowing candidate genomic regions.
• Broad Population Compatibility - The method can be applied to multiple mapping populations, including F₂, Recombinant Inbred Lines (RILs), Doubled Haploids (DH), and other segregating populations.
• Versatile Across Crop Species - QTL-seq has been successfully implemented in numerous crops, including rice, wheat, maize, soybean, rapeseed, tomato, barley, and many others possessing suitable reference genomes.
QTL-seq is particularly valuable for identifying major-effect genes controlling economically important agronomic traits such as disease resistance, abiotic stress tolerance, flowering time, grain quality, plant height, and yield. By shortening the path from population development to candidate gene identification, QTL-seq significantly accelerates crop improvement programs and functional genomic research.
QTL-seq Pipeline Overview
At N2Jenomics Lab Pvt. Ltd., we offer a comprehensive end-to-end QTL-seq workflow covering experimental design, sequencing, bioinformatics analysis, and biological interpretation. Our standardized pipeline delivers accurate, reproducible, and publication-ready results that support both academic research and commercial breeding programs.
QTL-seq Workflow Steps
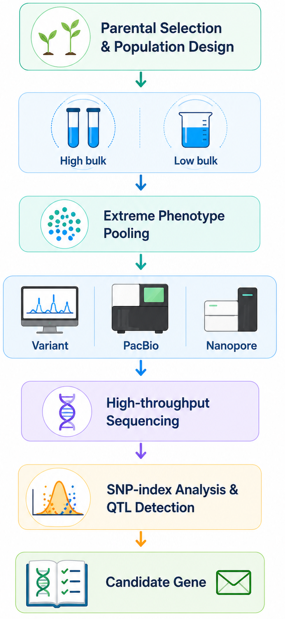
1. Parental Selection and Population Development
• Select two genetically contrasting parental lines exhibiting distinct phenotypes.
• Develop an appropriate segregating mapping population, such as F₂, RIL, or DH populations.
2. Extreme Phenotype Selection
• Identify individuals representing the highest and lowest trait values.
• Typically, 20–50 individuals are selected for each phenotypic group to maximize allele frequency differences.
3. DNA Pooling
• Extract high-quality genomic DNA from selected individuals.
• Combine equal quantities of DNA from each group to generate High and Low phenotype bulks.
4. Next-Generation Sequencing
• Perform whole-genome resequencing using high-throughput sequencing platforms such as Illumina, PacBio, or Oxford Nanopore Technologies (ONT).
• Generate sufficient sequencing depth to ensure reliable variant detection and allele frequency estimation.
5. Read Alignment and Variant Detection
• Align sequencing reads to the reference genome using validated bioinformatics workflows.
• Identify high-confidence single nucleotide polymorphisms (SNPs) and insertions/deletions (Indels) following stringent quality filtering.
6. SNP-index and ΔSNP-index Analysis
• Calculate the SNP-index, representing the allele frequency at each polymorphic locus within each bulk.
• Compute the ΔSNP-index by comparing allele frequencies between contrasting bulks to identify genomic regions associated with the target trait.
7. Candidate QTL Identification
• Visualize genome-wide ΔSNP-index distributions using sliding-window analysis.
• Apply statistical confidence intervals and permutation-based significance testing to detect robust QTL regions while minimizing false positives.
8. Functional Annotation and Candidate Gene Discovery
• Annotate variants located within significant QTL intervals.
• Identify functional mutations affecting coding sequences and regulatory regions.
• Perform Gene Ontology (GO) and KEGG pathway enrichment analyses to prioritize biologically relevant candidate genes.
Key Outcomes
• Rapid identification of genomic regions associated with target traits
• High-resolution QTL mapping with genome-wide visualization
• Accurate SNP-index and ΔSNP-index analysis
• Comprehensive annotation of SNPs and Indels within QTL regions
• Prioritized candidate gene lists for downstream validation
• Publication-ready figures, statistical analyses, and comprehensive reports
• Actionable insights to support marker-assisted breeding and functional genomics research
Bioinformatics Analysis
Our bioinformatics team applies validated pipelines to ensure accurate and reproducible QTL-seq results. Each stage of analysis is performed under strict quality control to deliver high-confidence outputs suitable for publication and downstream research.
Analysis Step
Description
Tools / Methods
Deliverables
Data Quality Control
Filter low-quality reads, remove adapters, check GC content and duplication.
FastQC, Trimmomatic
Clean FASTQ files, QC report
Read Alignment
Map clean reads to the reference genome with high accuracy.
BWA-MEM, Bowtie2
BAM alignment files
Variant Calling
Detect SNPs and Indels across pooled bulks.
GATK, SAMtools, FreeBayes
Raw VCF file with all variants
Variant Filtering
Apply depth, quality, and frequency thresholds to remove unreliable calls.
Define significant genomic regions associated with traits.
QTL IciMapping, custom R scripts
Candidate QTL intervals
Functional Annotation
Annotate variants within QTL intervals, identify candidate genes.
ANNOVAR, Ensembl VEP
Candidate gene list with variant annotations
Pathway & Enrichment Analysis
Explore biological functions of candidate genes (GO/KEGG).
clusterProfiler, KEGG Mapper
Functional enrichment plots and tables
Sample Requirements
Sample Type
Requirement
Notes
Parental Lines
Two parents with contrasting phenotypes (e.g., resistant vs susceptible).
Preferably sequenced; ensures higher accuracy in variant detection.
Mapping Population
F2, RILs, or DH populations.
Population size: ≥200 individuals recommended.
Bulk Construction
20–50 individuals per extreme pool.
Select based on highest and lowest trait values. For QTG-seq: ≥1000.
DNA Quantity
≥2 µg per bulk. Concentration ≥50 ng/µL.
Provide sufficient DNA for resequencing libraries.
DNA Purity
OD260/280 = 1.8–2.0; OD260/230 ≥2.0.
Free from RNA contamination and inhibitors.
DNA Integrity
Clear high molecular weight band on agarose gel.
No visible degradation or smearing.
Phenotypic Data (Optional)
Trait measurements for all mapping individuals.
Increases statistical power for QTL detection and validation.
Deliverables
Clients receive a comprehensive results package designed for downstream research and publication.
• Clean sequencing data (FASTQ files with QC report)
• Variant files (VCF with SNPs and Indels)
• SNP-index and ΔSNP-index plots
• Candidate QTL regions with significance statistics
• Annotated candidate gene lists
• GO/KEGG enrichment results
• Publication-ready analysis report
Q: How does QTL-seq differ from traditional QTL mapping?
A: QTL-seq combines bulked segregant analysis (BSA) with next-generation sequencing to identify genomic regions associated with a target trait. Unlike traditional QTL mapping, which requires genotyping large numbers of individual samples, QTL-seq sequences pooled DNA from individuals showing extreme phenotypes. This approach significantly reduces both time and cost while enabling rapid detection of trait-linked QTLs through SNP-index and ΔSNP-index analysis.
Q: How many individuals should be included in each bulk?
A: Each bulk should typically contain several dozen individuals representing the extreme ends of the phenotype (e.g., highly resistant vs. highly susceptible). Larger bulk sizes generally improve the accuracy of allele frequency estimation and increase the statistical power to detect QTLs. The optimal number depends on the population type, trait heritability, and experimental design.
Q: Is sequencing both parental lines necessary for QTL-seq?
A: Yes. Sequencing both parents is highly recommended because it helps identify polymorphic markers between the parental genomes and filters out background genetic variation. This improves the accuracy of SNP-index calculations and enhances the detection of significant QTL regions.
Q: What sequencing depth is recommended for QTL-seq?
A: Adequate sequencing depth is essential for accurate estimation of allele frequencies within each bulk. Moderate to high genome coverage is generally recommended to ensure reliable SNP detection and minimize background noise. The ideal sequencing depth depends on the genome size, complexity of the organism, and study objectives.
Q: Can QTL-seq be applied to different crop species?
A: Yes. QTL-seq is widely used across a broad range of crop species, including rice, wheat, maize, soybean, rapeseed, and many others. Successful implementation requires a high-quality reference genome and sufficient genetic variation between the parental lines.
Q: How is statistical significance determined in QTL-seq analysis?
A: QTL-seq identifies significant genomic regions by analyzing ΔSNP-index values against statistical confidence intervals, commonly set at 95% or 99%. Sliding window analysis is used to smooth SNP-index values and reduce random variation, while stringent filtering of low-quality variants and insufficient sequencing depth further improves the reliability of QTL detection.
Address:Registered Office: 138, Patparganj Industrial Area, New Delhi – 110092, India
Operational Address: National Institute of Plant Genome Research (BRIC - NGGF)
Lab No. 206 and 207, Aruna Asaf Ali Marg, P.O. Box No. 10531,
New Delhi – 110067, India